The Hill Country Growth Paradox: Why Buyers Have More Leverage in Comal County

Real Estate · Local Market
The Hill Country
Growth Paradox
Comal County added nearly 48,000 people since 2020—so why do buyers have more leverage?
FM 306 at sunset in the Texas Hill Country. Original photograph by Alison; color and exposure gently enhanced.
If you drive Highway 46 at sunrise or Highway 281 at sunset, you can see it: new rooftops, more traffic, fresh signs of growth everywhere you look.
Comal County has added nearly 48,000 people since 2020. And yet—unlike the bidding-war years many of us remember—buyers today often have more time, more inventory and more negotiating power.
That is the paradox. Growth is unmistakable, but the housing market is no longer moving at the same speed. Understanding why is the key to making the right move in today’s Hill Country market.
The big picture
First, the growth is real.
Comal County’s estimated population reached 209,166 in 2025—up 29.6% from the 2020 Census base.
That works out to 47,717 additional residents in roughly five years, or close to 25 new neighbors per day. Population does not arrive in a perfectly even stream, of course, but the daily average helps translate an enormous countywide number into something we can picture.
This is not only a New Braunfels story. Growth is spreading along the Highway 46 and U.S. 281 corridors and through the communities around Canyon Lake, Spring Branch, Bulverde and Fischer.

Zoom in
But growth does not mean one market.
Countywide numbers are useful. Addresses are specific.
Comal County includes established neighborhoods, acreage communities, lakefront property, new subdivisions and rural land. Conditions in Spring Branch are not identical to Canyon Lake, Bulverde or New Braunfels—and two homes in the same ZIP code may have entirely different water, access, restriction and resale considerations.
That is why local market knowledge matters. The countywide trend gives us the context; the property-level details tell us what the context means for one decision.
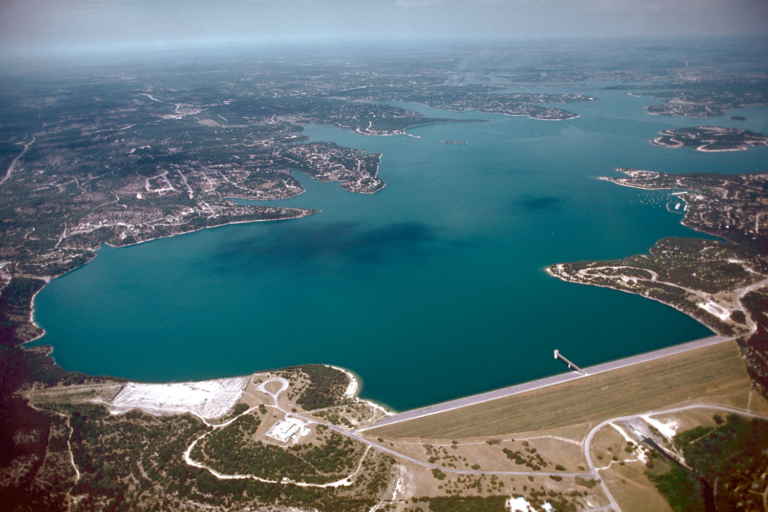
Canyon Lake & Western Comal
Actual north-up aerial view

A decade of change
Canyon Lake has been growing for years.
The Canyon Lake census-designated place grew by roughly 46% between the 2010 and 2020 censuses.
The count rose from 21,262 residents to 31,124 in one decade. That helps explain the visible change around the lake—but it does not tell you whether a particular home has water access, usable topography, short-term-rental restrictions, a conventional septic system or a practical route to work.
What “near the water” really means here: The federal government owns the land covered by Canyon Lake at the normal conservation pool and a strip of land of varying width around it. Private, exclusive use of that public land is not allowed, and national U.S. Army Corps of Engineers policy prohibits private floating facilities at Canyon Lake. A home may offer a lake view or sit beside Corps land without including private shoreline or a private dock. USACE adjacent-landowner guidance · Canyon Lake Master Plan.
→
Ownership is also a defining part of the community: Census QuickFacts reports an 87.1% owner-occupied housing rate and a $389,300 median value of owner-occupied housing units for 2020–2024.
The second half of the paradox
So why does the market feel slower?
Population growth describes how many people are here. Market pace describes how buyers, sellers, prices, financing and inventory interact right now. Those two stories can move in different directions at the same time.
Higher borrowing costs have changed monthly affordability. More homes are available. Buyers have become more selective, and listings that miss on price or presentation can sit while the best-positioned homes still sell.
Comal County, June 2026. Source: Four Rivers Association of REALTORS® market report using Texas REALTORS® data. Months of inventory is a supply estimate; it is not a promise of how quickly any particular home will sell.
The affordability lever
Mortgage rates changed the speed of the market.
6.66%30-year fixed average · July 30, 2026
Rates do not erase demand, but they change what a payment feels like. A buyer may still love the Hill Country and decide to wait, reduce the price range, negotiate a credit or choose a home that needs less immediate work.
Rate source: Freddie Mac Primary Mortgage Market Survey via FRED.
For buyers
More choices can be an advantage—if you stay specific.
This is not a frozen market. It is a more selective one. Buyers may have time to compare, ask better questions and negotiate with more confidence than they could during the most competitive years.
The opportunity is not simply “more inventory.” It is the ability to separate a beautiful listing from the property that actually fits your life, budget and long-term plans.
- Get fully pre-approved and compare the payment—not only the list price.
- Study price reductions and days on market without assuming every older listing is a bargain.
- Investigate water, septic, restrictions, insurance, road access and future maintenance early.
- Use inspection findings and comparable sales to shape a thoughtful offer.
- Do not rush because of old-market habits, but do not ignore a correctly priced standout property.
For sellers
Demand still exists, but the market is less forgiving.
A growing county is encouraging, yet population growth cannot rescue an unrealistic price. Buyers are comparing more options, calculating payments carefully and noticing condition, presentation and deferred maintenance.
The homes that create momentum tend to make the decision easy: the price reflects the current competition, the condition inspires confidence, and the marketing makes the home’s particular Hill Country story clear.
- Price for today’s active competition and recent closed sales—not yesterday’s headlines.
- Address visible repair issues before photography whenever possible.
- Explain the details buyers cannot see: utilities, upgrades, restrictions, access and property history.
- Make the first two weeks count with polished presentation and easy showing access.
- Reassess quickly if the market gives you silence rather than serious interest.

The Root & Roam view
The details behind the address tell the real story.
Countywide data gives us the big picture. Then we zoom in: the neighborhood, the road, the restrictions, the utilities, the land and the individual home.
The Hill Country is still growing. Today’s market simply asks buyers and sellers to move with more preparation, more patience and better information. That is not bad news. It is a market in which clarity matters—and clarity is something we can create.
— Alison
Sources & methodology
How to read these numbers
- Population estimates, decennial census counts and American Community Survey profiles are different Census Bureau products. Dates and geographic definitions are labeled so unlike measures are not presented as identical.
- “Nearly 48,000” is the difference between Comal County’s April 1, 2020 estimates base of 161,449 and July 1, 2025 estimate of 209,166: 47,717 people. The “approximately 25 per day” figure is a reader-friendly average across the interval, not a claim that growth occurred evenly each day.
- The Spring Branch comparison intentionally illustrates a geography problem: incorporated city limits and ZIP Code Tabulation Area 78070 describe very different footprints.
- The example mortgage payment uses a $449,000 price, 20% down, a $359,200 loan and a 6.66% fixed rate for 360 monthly payments. It is educational only and excludes taxes, insurance, fees and other costs.
- Real-estate conditions can vary by neighborhood, property type and price point. Market statistics describe a group of transactions and listings; they are not a valuation of a specific property.
This article is for general informational purposes and is not financial, tax, legal or lending advice. Equal Housing Opportunity. Consult the appropriate licensed professionals for guidance specific to your situation.